WARNING: This guide describes an older version of CashTrails.
10. Report Results
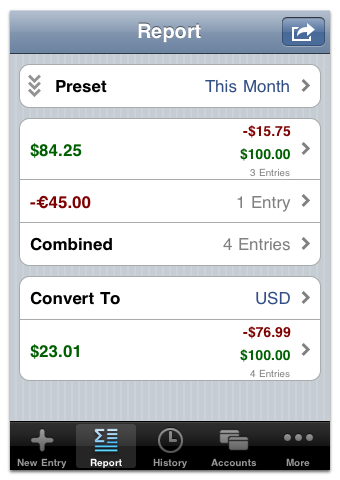
The top-level Report screen shows a report result summary. This includes the total amount of expenses and income for a particular currency, as well as the resulting combined amount - either negative or positive.
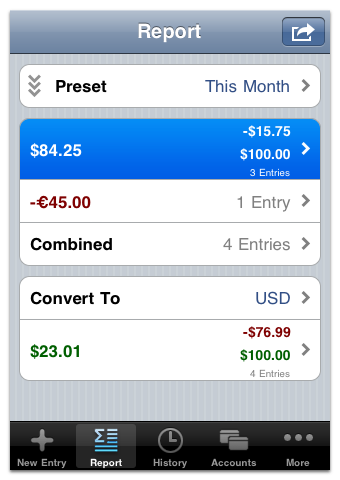
Tapping a row will show the details for the corresponding currency.
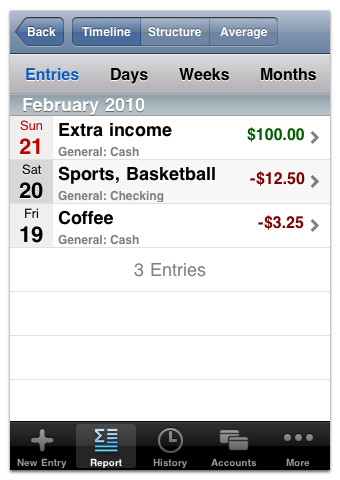
The report result details screen has three sections: Timeline, Structure and Average.
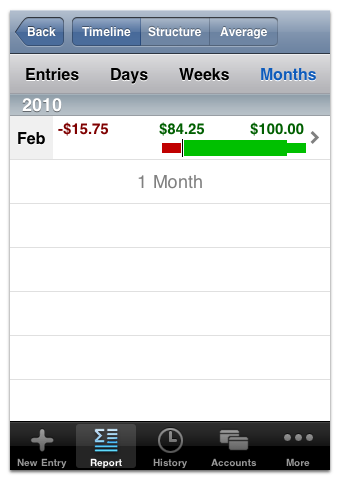
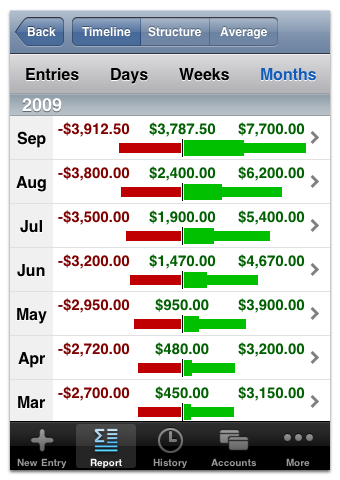
Under Timeline you can see either a list of all entries included in the result, or the corresponding bar graphs of expenses and income for days, weeks and months.
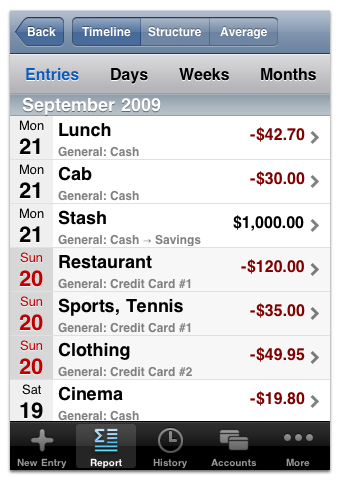
After using CashTrails for a while, you will accumulate many more entries, and the timeline may look like this:
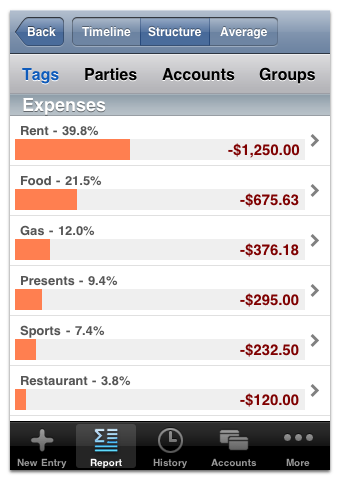
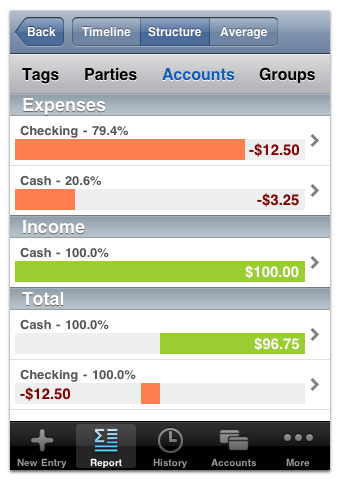
Under Structure, you can get a breakdown of your expenses and income by tags, parties, accounts and groups.
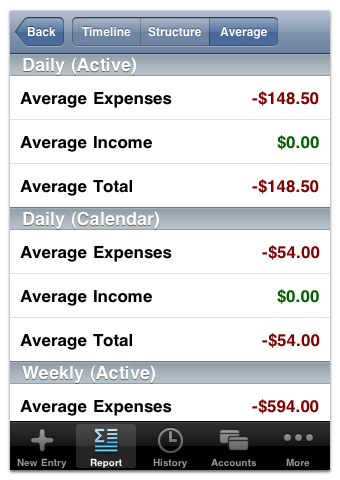
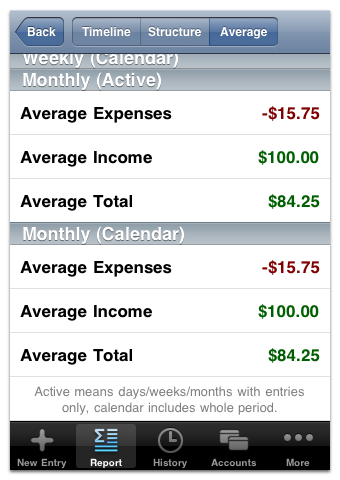
Under Average, you can get the average amounts of expenses and income for days, weeks and months. Two kinds of average values are reported: active - for the days with entries only, and calendar - for all days that constitute the reported time period.